

Dynamics 365 Contact Center routing is powerful. But when something does not route how you expect, it’s not easy to identify what happened.
If you want to troubleshoot Contact Center conversations properly, you need the telemetry somewhere you can query it. For Dynamics 365 Contact Center, that means connecting the Customer Service environment to Azure Application Insights and enabling the data export.
It is not a complicated setup, but there are a couple of prerequisites that are easy to overlook: the environment has to be managed, the Azure permissions have to be in place, and you can only have one Customer Service-to-Application Insights export configuration per environment.
This is Part 1 of a two-part series. Here, we will get the data flowing into Application Insights. In Part 2, we will use that connection to configure the Diagnose dashboard in Dynamics 365 Contact Center.
What you’re setting up
Conversation diagnostics captures lifecycle events from Contact Center conversations and writes them to Azure Application Insights. Once the export is running, you can query the data, use it for operational troubleshooting, and combine it with other data to build your own monitoring views.
The setup looks like this:
Dynamics 365 Contact Center / Customer Service environment
                    ↓
     Power Platform data export configuration
                    ↓
       Azure Application Insights resource
                    ↓
 Conversation lifecycle events in the Traces table
This is the foundation for the Diagnose dashboard configuration in Part 2, but it is useful on its own if you want to inspect conversation events directly in Azure.
Before you start
You will need:
- An Azure subscription and permission to create or use an Application Insights resource.
- Contributor access, or higher, on the Azure resources used for the setup.
- At least Read access to query the Application Insights data afterward.
- A Power Platform Administrator or System Administrator role in the Power Platform environment.
- A managed environment. This is required; the data-export option will not work against an unmanaged environment.
One other thing to keep in mind: Application Insights ingestion is billed through Azure Monitor. Conversation diagnostics is valuable telemetry, but it is still telemetry being stored in Azure, so factor the volume into your normal Azure monitoring-cost review.
⚠️ Cloud limitation: Microsoft does not currently support exporting Power Automate and Customer Service data to Application Insights in sovereign clouds, including GCC, GCC High, and DoD.
Step 1 — Create the Application Insights resource
The data-export wizard can only connect to an existing Application Insights resource, so create that resource first if you do not already have one for this Contact Center environment.
- In the Azure portal, select Create a resource.
- Search for and select Application Insights.
- Choose the subscription and resource group that will own the Contact Center telemetry.
- Give the resource a clear name, such as
ContactCenterAppInsights, and select the appropriate region. Take note of the subscription, resource group, and resource name as you’ll need those later in the setup. - Select an existing Log Analytics workspace, or allow Azure to create one as part of the deployment.
- Select Review + create, then Create.
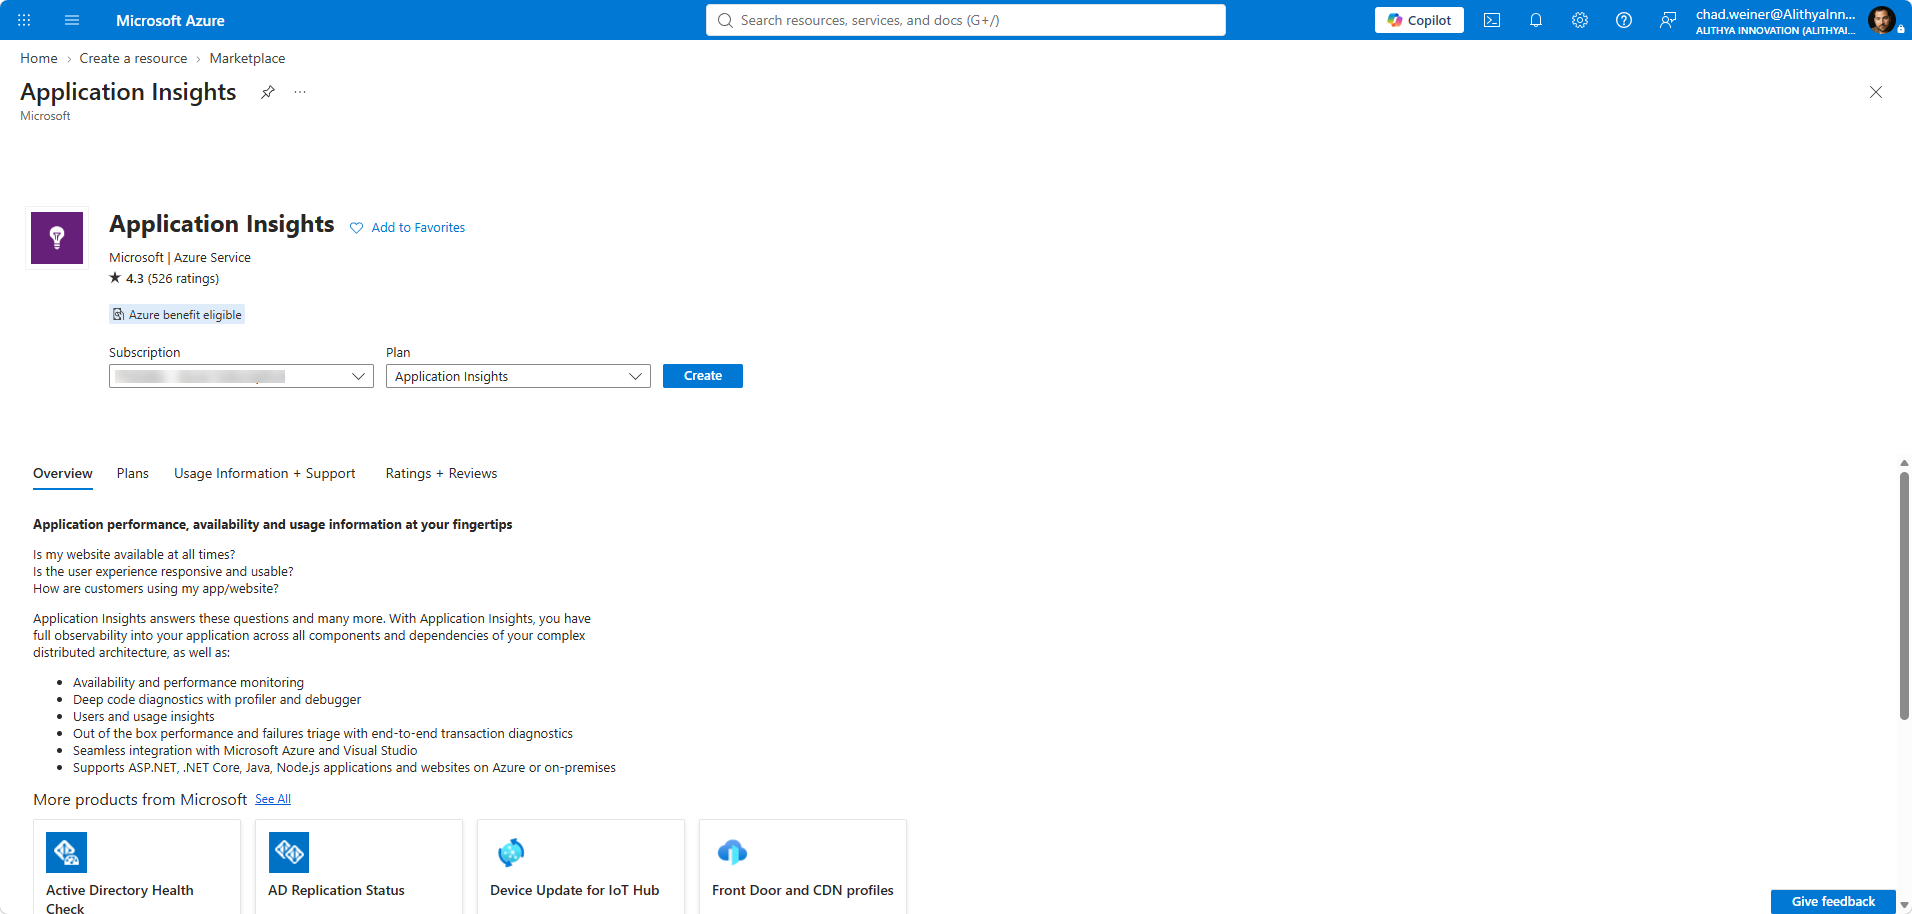
Application Insights resources are workspace-based. If you do not associate an existing Log Analytics workspace during creation, Azure creates one automatically. The resource name is not just an Azure housekeeping detail — it is the instance you will select in the Power Platform data-export wizard in Step 6.
💡 Keep the resource and workspace ownership clear. This telemetry is likely to become a troubleshooting tool for both the Contact Center and Azure teams, so use a subscription and resource group where the right people can find and query it later.
Step 2 — Confirm the environment is managed
In the Power Platform admin center, go to Manage → Environments, then open the Contact Center environment you want to connect.
If it is not already managed, select Enable Managed Environments from the command bar and complete the confirmation. You need to do this before creating the export.
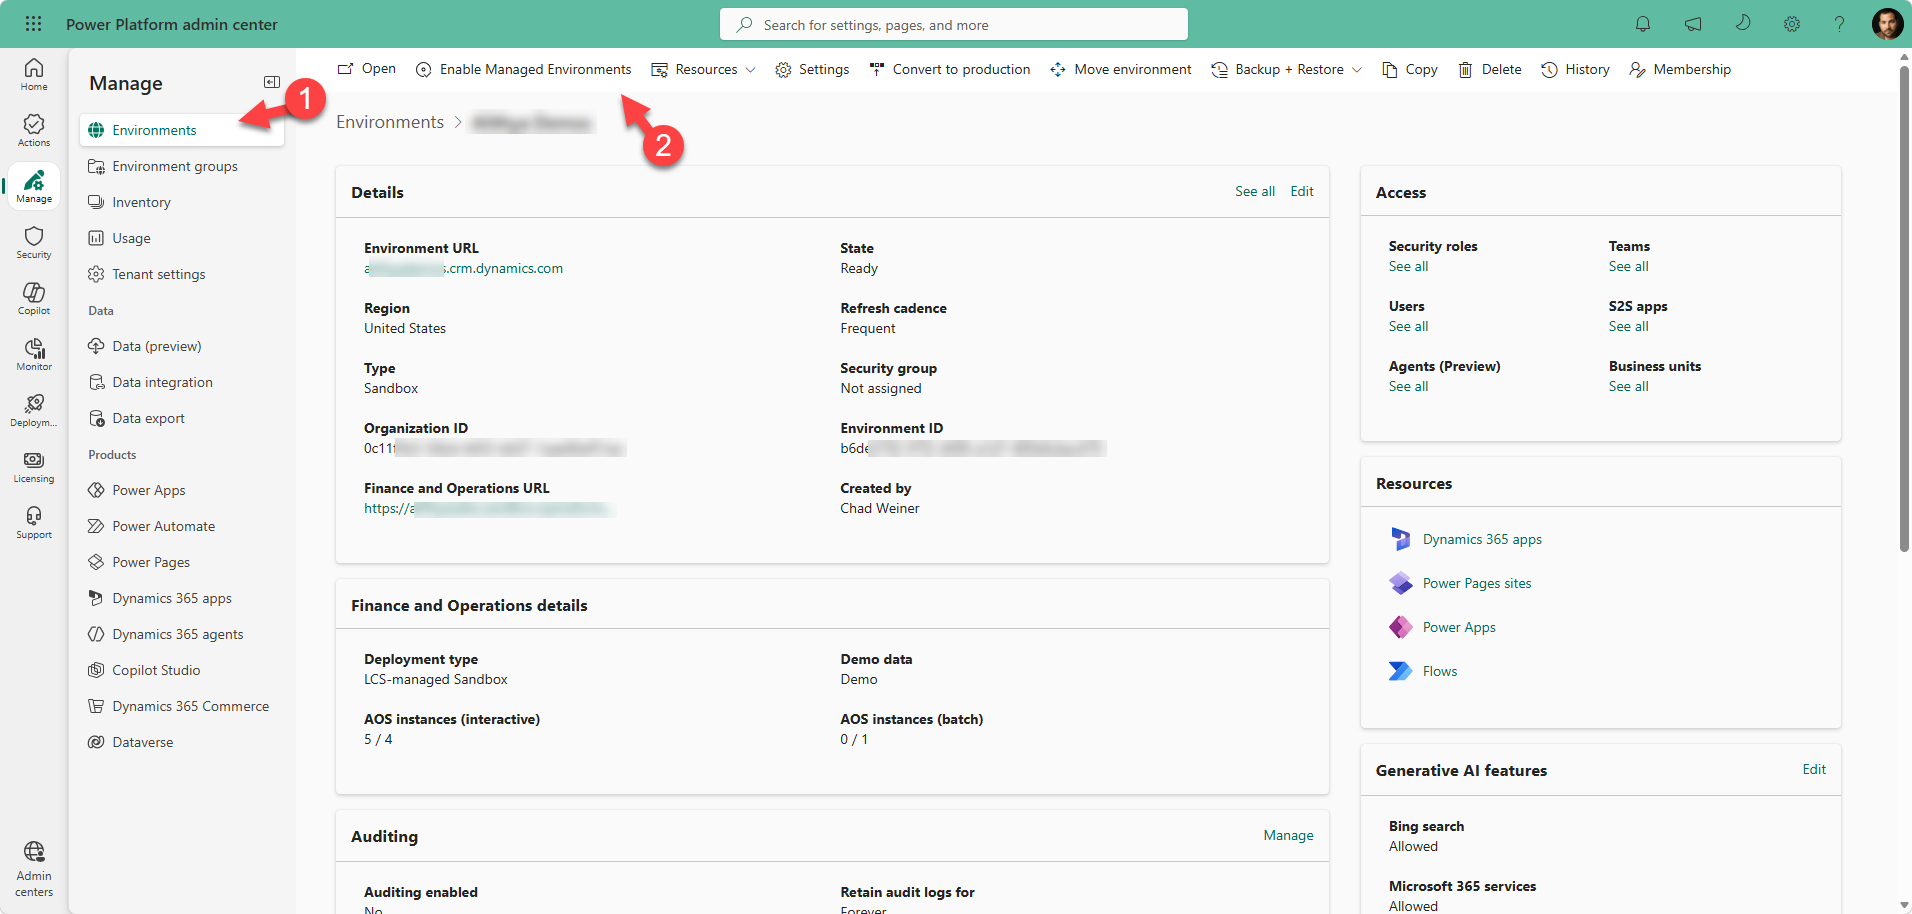
This step is easy to skip when you are working in a sandbox or a long-running demo environment. If the export setup is missing or refuses the selected environment, this is the first thing I would check.
Step 3 — Open Data export and start a new App Insights export
Still in the Power Platform admin center:
- Select Manage → Data export.
- Open the App Insights tab.
- Select New data export.
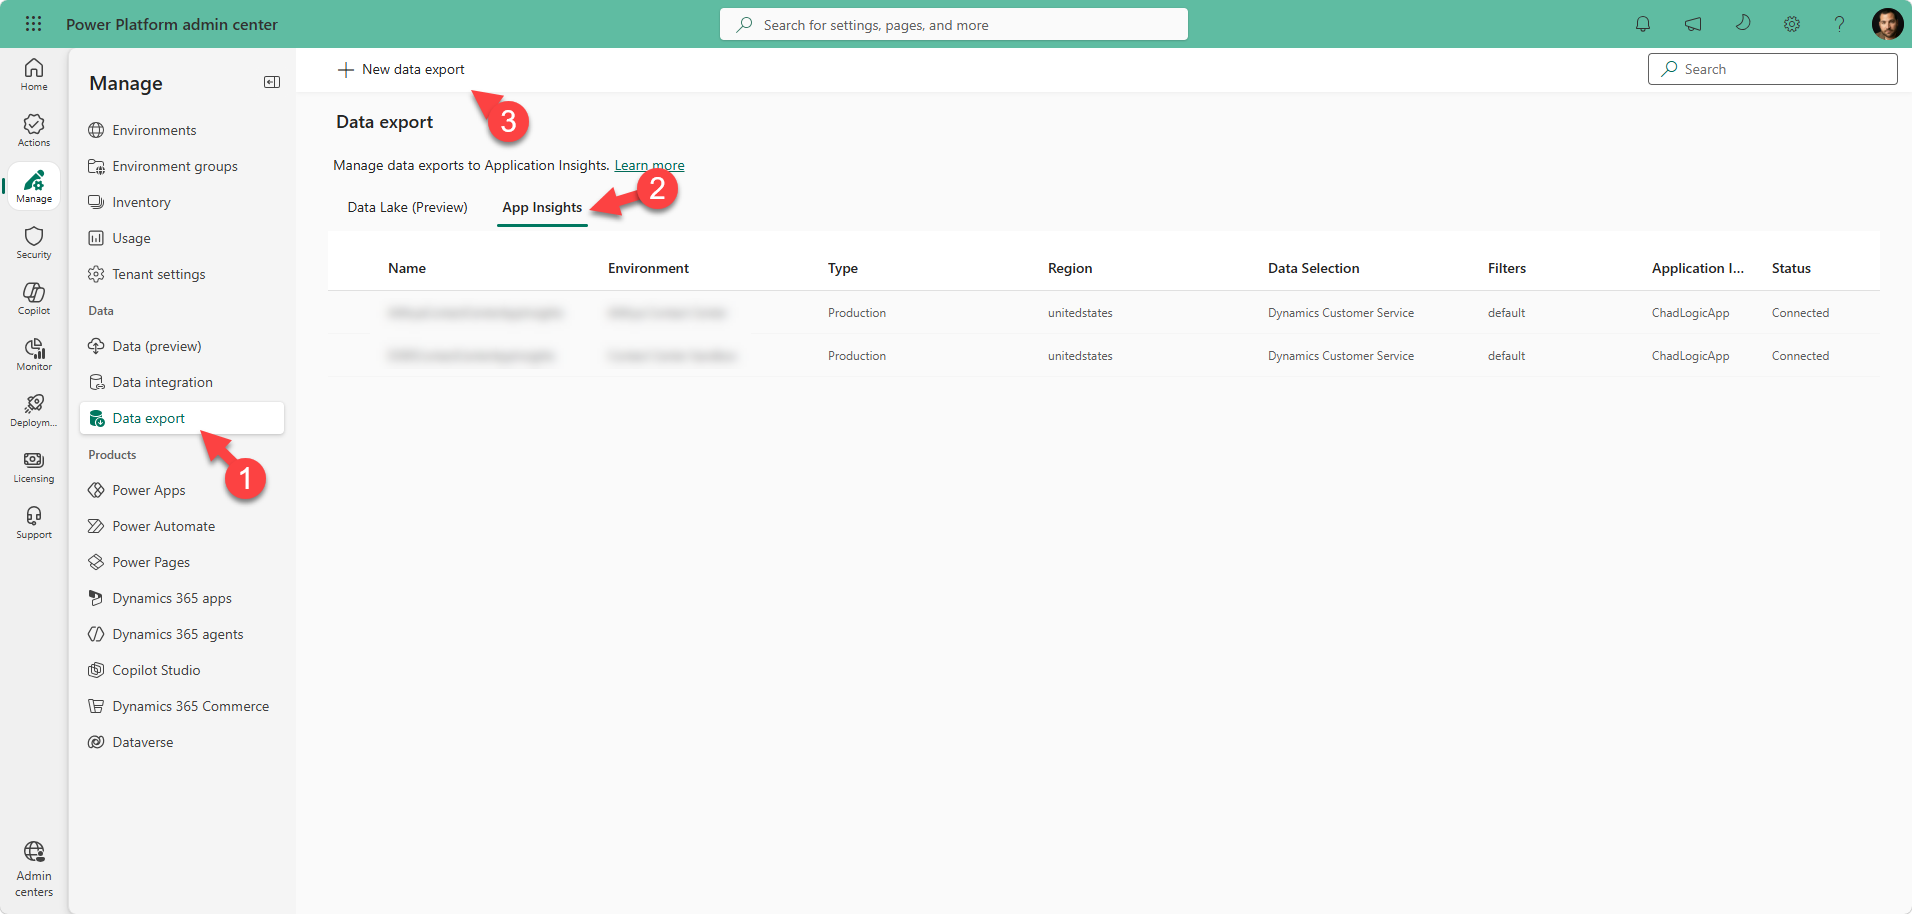
You may already see other export packages on this page. That does not necessarily mean this one is configured; check the environment and the data-selection type carefully.
Step 4 — Choose Dynamics Customer Service for the export package
Give the export package a useful name. Something like ContactCenterAppInsights makes it obvious what it is when you come back to this screen later.
For the data package, select Dynamics Customer Service. In some tenants or screenshots, the label may still include (preview).
Do not select the similarly named options for Dataverse diagnostics and performance, Power Automate, Power Apps, or Copilot Studio. Those are separate export scenarios. For Contact Center conversation diagnostics, Dynamics Customer Service is the one you want.
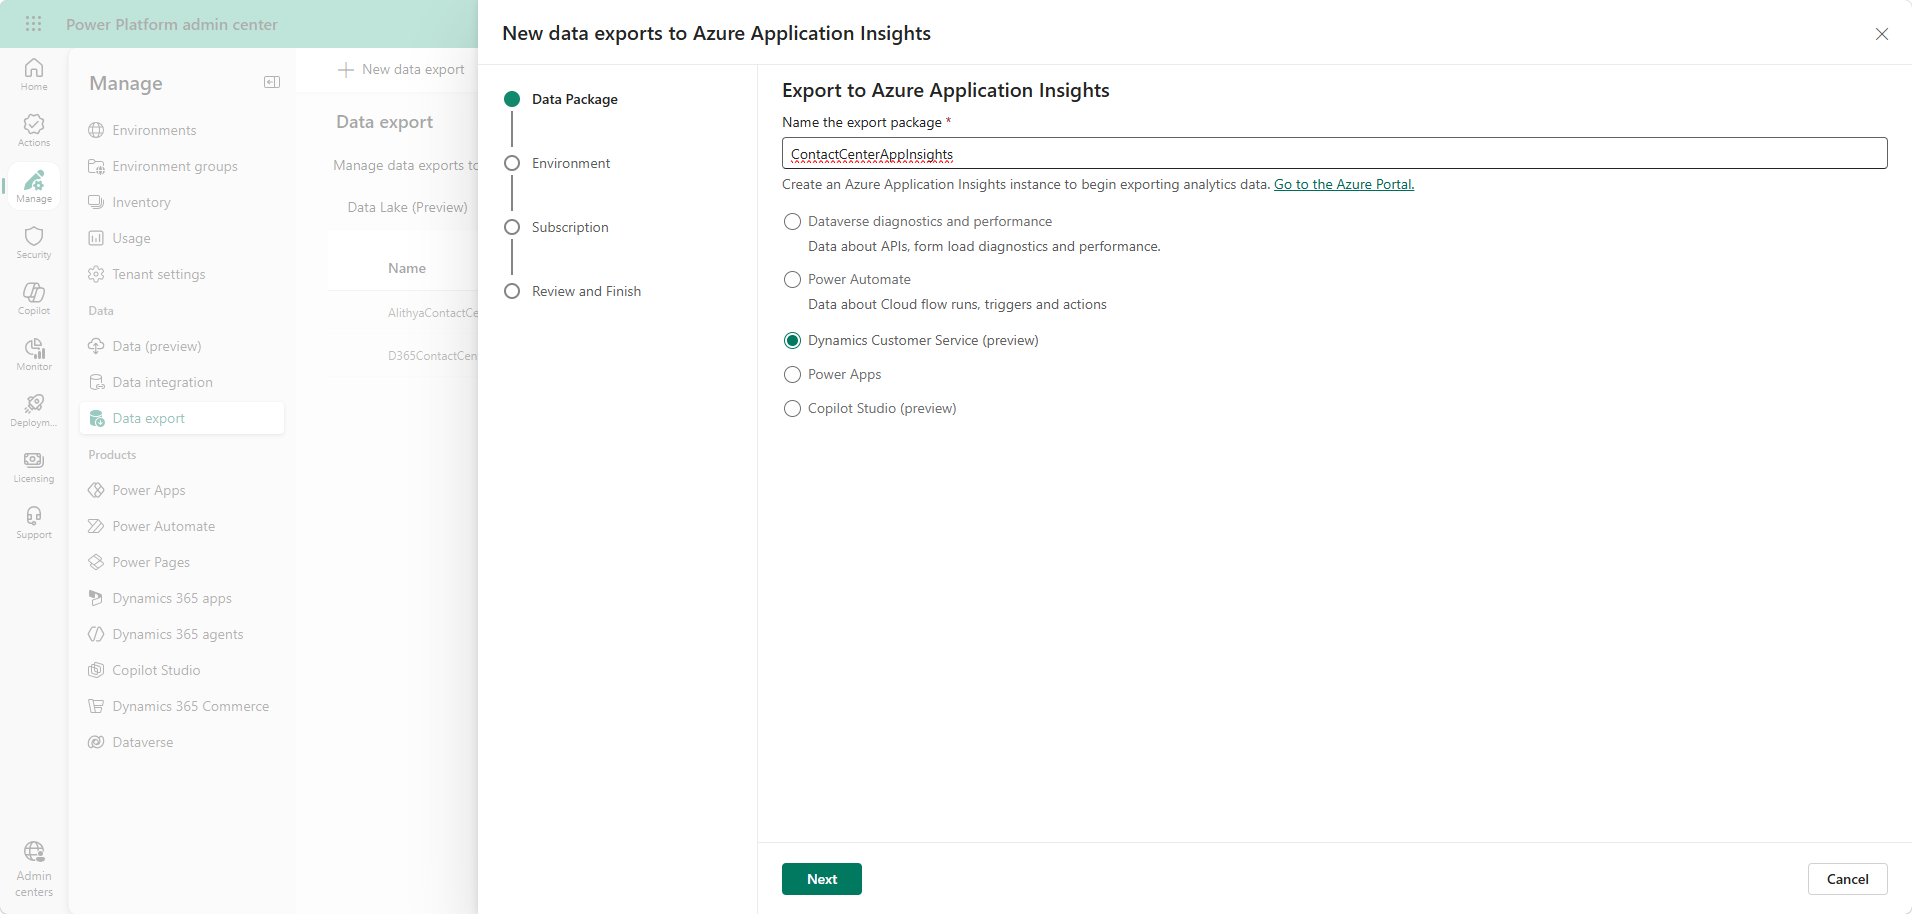
Select Next when the package name and data selection look right.
Step 5 — Select the Contact Center environment
Choose the managed Dynamics 365 Customer Service / Contact Center environment that should send telemetry to Application Insights, then select Next.
This is where the one-export-per-environment limitation matters. Microsoft supports only one Dynamics Customer Service-to-Application Insights data export configuration for a given environment. If someone has already connected that environment, review the existing configuration instead of creating a second one.
Step 6 — Select the Application Insights resource
Choose the Azure Subscription, Resource group, and Application Insights instance that should receive the data, then select Next.
Pick the resource deliberately. The Application Insights instance becomes the place your operations and support teams will query when a conversation needs attention. Keeping Contact Center telemetry in an instance with a clear ownership model makes the next steps much easier.
On the review page, confirm the environment, selected data package, and Application Insights instance. Then select Create.
Once the export appears on the Data export page, check that its status is Connected.
Verify that conversation data is arriving
Once the connection is established, it may take a few minutes for data to start flowing from Dataverse into Application Insights. Also, historical data isn’t synced. You may manual call in/chat in to get some fresh conversations in the system.
After the export is configured, open the same Application Insights instance in the Azure portal:
- Go to Monitoring → Logs.
- Start with the
Tracestable. - Filter for a known conversation or work item once your environment has generated activity.
Microsoft’s sample query is a useful starting point:
Traces
| extend customDim = parse_json(customDimensions)
| extend workItem = tostring(customDim["powerplatform.analytics.resource.id"])
| extend subscenario = tostring(customDim["powerplatform.analytics.subscenario"])
| where workItem == "Insert conversation ID of work item"
// | where subscenario contains "Classification"
| project timestamp, workItem, subscenario, customDim
The useful fields are in customDimensions, which is why the query parses it first. From there, you can see the work item, the conversation subscenario, and the additional context behind each lifecycle event.
For a first test, use a conversation you can identify confidently and give the export a little time to process it. A blank query immediately after creating the connection does not necessarily mean the configuration is wrong.
Here is a good resource for queries you can use.
Common setup mistakes
Most failures here come down to selecting the wrong option or overlooking an environment requirement:
| Symptom | First thing to check |
|---|---|
| The environment cannot be selected | Confirm it is a managed environment. |
| The wrong telemetry is arriving | Confirm the package uses Dynamics Customer Service, not another data-export type. |
| You cannot create another export | Check for the existing Customer Service-to-App Insights export for that environment. |
| You can see the resource but cannot query it | Verify that your Azure account has at least Read access to Application Insights. |
| No conversation results yet | Use a known test conversation and allow time for the export to process it. |
What comes next
At this point, the important thing is in place: the Contact Center environment has a path to Application Insights, and conversation lifecycle telemetry has a home outside the application.
That gives you direct access to the data in Azure today. In Part 2, we will take the next step and wire that Application Insights instance into the native Diagnose dashboard in the Customer Service Workspace so you can use the telemetry from inside Dynamics 365 Contact Center.