

Did you already read Part 1?
The Diagnose dashboard, found on the Debug tab in the Diagnose experience, can give you a useful view of Contact Center conversation telemetry from Application Insights. Getting it working is less straightforward than turning on a single setting, though.
The dashboard depends on an Entra app registration, a federated identity credential, Azure permissions, Dataverse configuration, an environment variable, and a Power Platform setting. If one part is off, the page often returns a generic message: Error loading chart data. Please check your query and try again.
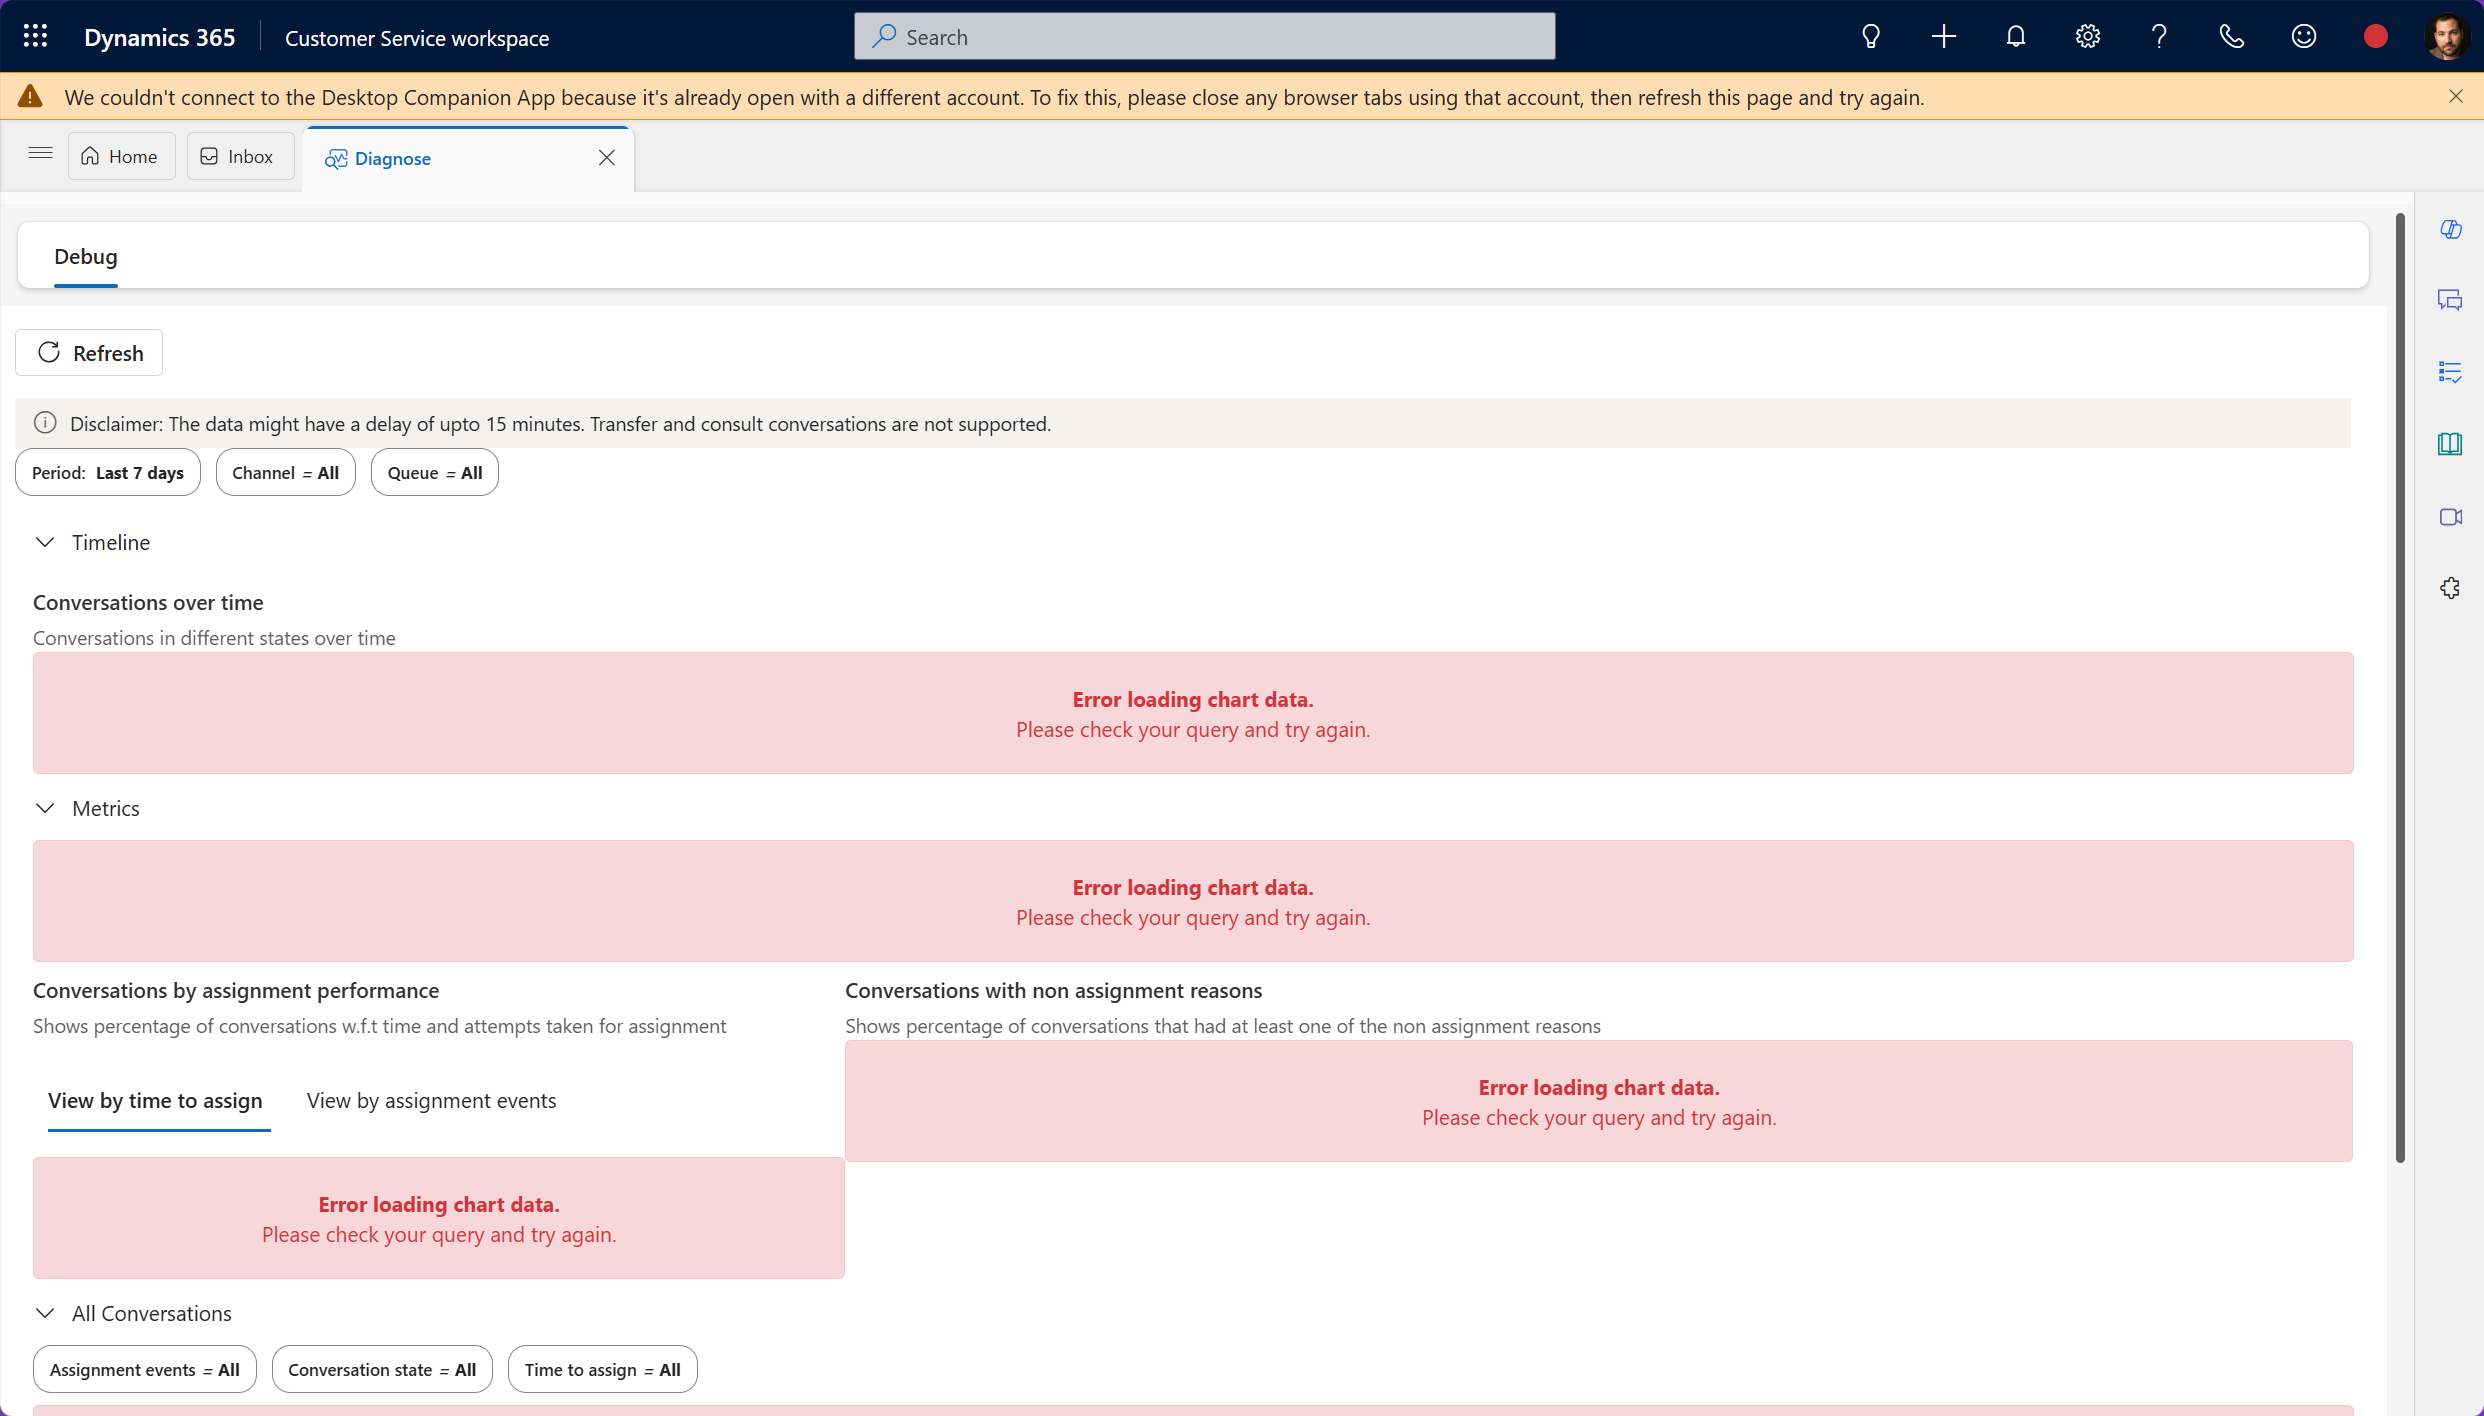
This is the failure state this post is meant to fix. The dashboard shell and filters still load, but the charts cannot query the telemetry behind them until the identity and Application Insights configuration are complete.
This walkthrough covers the full setup and one small mistake that can make the entire chain fail: a missing character in the environment GUID embedded in the federated credential subject.
What the dashboard needs
Dataverse queries Application Insights through an Entra app registration. The app registration uses a federated identity credential (FIC), so there is no stored client secret for the diagnostics plugin.
These are the pieces that need to line up:
| Component | Where you configure it |
|---|---|
| App registration | Microsoft Entra ID |
| Federated identity credential | App registration |
| Application Insights access | Azure role-based access control |
| Managed identity record | Dataverse |
msdyn_AppInsightsId |
Power Apps solution environment variable |
EnableApplicationInsightsDashboard |
Power Apps solution setting |
The dashboard will not load charts until the whole chain is configured.
Before you start
You need an Application Insights resource receiving your Contact Center telemetry, plus admin access to Microsoft Entra ID, Dataverse, and the Power Platform admin center.
Have these values available before you begin:
- Your Power Platform environment ID
- Your tenant ID
- Your Application Insights Application ID
Copy the environment ID from the Power Platform admin center. Do not retype it later. It becomes part of a longer identity string, and one missing character is hard to spot.
1. Create an Entra app registration
In the Azure portal, go to Microsoft Entra ID, then App registrations, and create a new registration. Give it a name that explains what it is for, such as ContactCenterConversationDiagnostics.
After you create it, copy these values from the Overview page:
- Application (client) ID
- Directory (tenant) ID
You will use both in the remaining configuration.
2. Add the federated identity credential
The FIC is the trust relationship that lets the Microsoft-signed diagnostics plugin obtain a token for the app registration. It avoids storing a secret in Dataverse.
On the app registration, open Certificates & secrets, choose Federated credentials, and add a credential using the Other issuer or custom scenario.
Set the issuer to the Entra endpoint for your tenant:
https://login.microsoftonline.com/<tenantId>/v2.0Set the subject identifier to the Diagnose dashboard subject value, replacing only the environment ID:
/eid1/c/pub/t/<encodedTenantId>/a/<encodedAppId>/n/plugin/e/<environmentId>/i/Microsoft Code Signing PCA 2024/s/Microsoft CorporationFor example:
/eid1/c/pub/t/QUVFMs3Q3U6iivoyhwAaaw/a/qzXoWDkuqUa3l6zM5mM0Rw/n/plugin/e/c8afaf8f-dbd5-4d21-9e8c-f51901d60c2e/i/Microsoft Code Signing PCA 2024/s/Microsoft CorporationThere are a few details here that matter:
- Do not create a certificate or calculate a hash for this setup. The Diagnose dashboard plugin is Microsoft-signed.
- Keep the
/i/Microsoft Code Signing PCA 2024/s/Microsoft Corporationportion unchanged. - Do not modify the encoded values in the
/t/and/a/segments. - The environment ID in the
/e/segment is the value you supply.
The self-signed /h/{hash} pattern in general managed identity documentation applies to custom plugins that you build and sign. It is not the format used by this Microsoft-signed diagnostics plugin.
3. Give the app access to Application Insights
The FIC lets the app obtain a token. Azure RBAC determines whether that token can read Application Insights.
Open the Application Insights resource in the Azure portal. Under Access control (IAM), add a role assignment for the app registration you created. Assign either Monitoring Reader or Reader.
Without that role assignment, the identity can authenticate but cannot read the telemetry needed by the charts.
4. Check the Dataverse managed identity record
Dataverse provisions a managed identity record in the managedidentities table when the diagnostics components are enabled. Confirm that the record contains the app registration and tenant IDs you configured.
While signed in to Dataverse, open this URL in the browser, replacing the organization name:
https://<yourorg>.crm.dynamics.com/api/data/v9.2/managedidentities?$select=managedidentityid,name,applicationid,tenantid,credentialsource,subjectscopeFind the record with an applicationid that matches your app registration. Check that it contains:
- Your application client ID
- Your tenant ID
credentialsourceset to2subjectscopeset to1
In many cases, the record is already correct once the app registration and FIC are in place. If it needs to be updated, use a tool that can send a PATCH request, such as Postman, XrmToolBox, or a browser console fetch request. A browser address bar only sends GET requests.
5. Set the Application Insights environment variable
Dataverse uses the system environment variable msdyn_AppInsightsId to identify the Application Insights instance.
In make.powerapps.com, select the correct environment and open Solutions, Default Solution, then Environment variables. Open AppInsights Id, whose schema name is msdyn_AppInsightsId and owner is SYSTEM.
Populate both fields with the Application Insights Application ID:
- Default Value
- Current Value
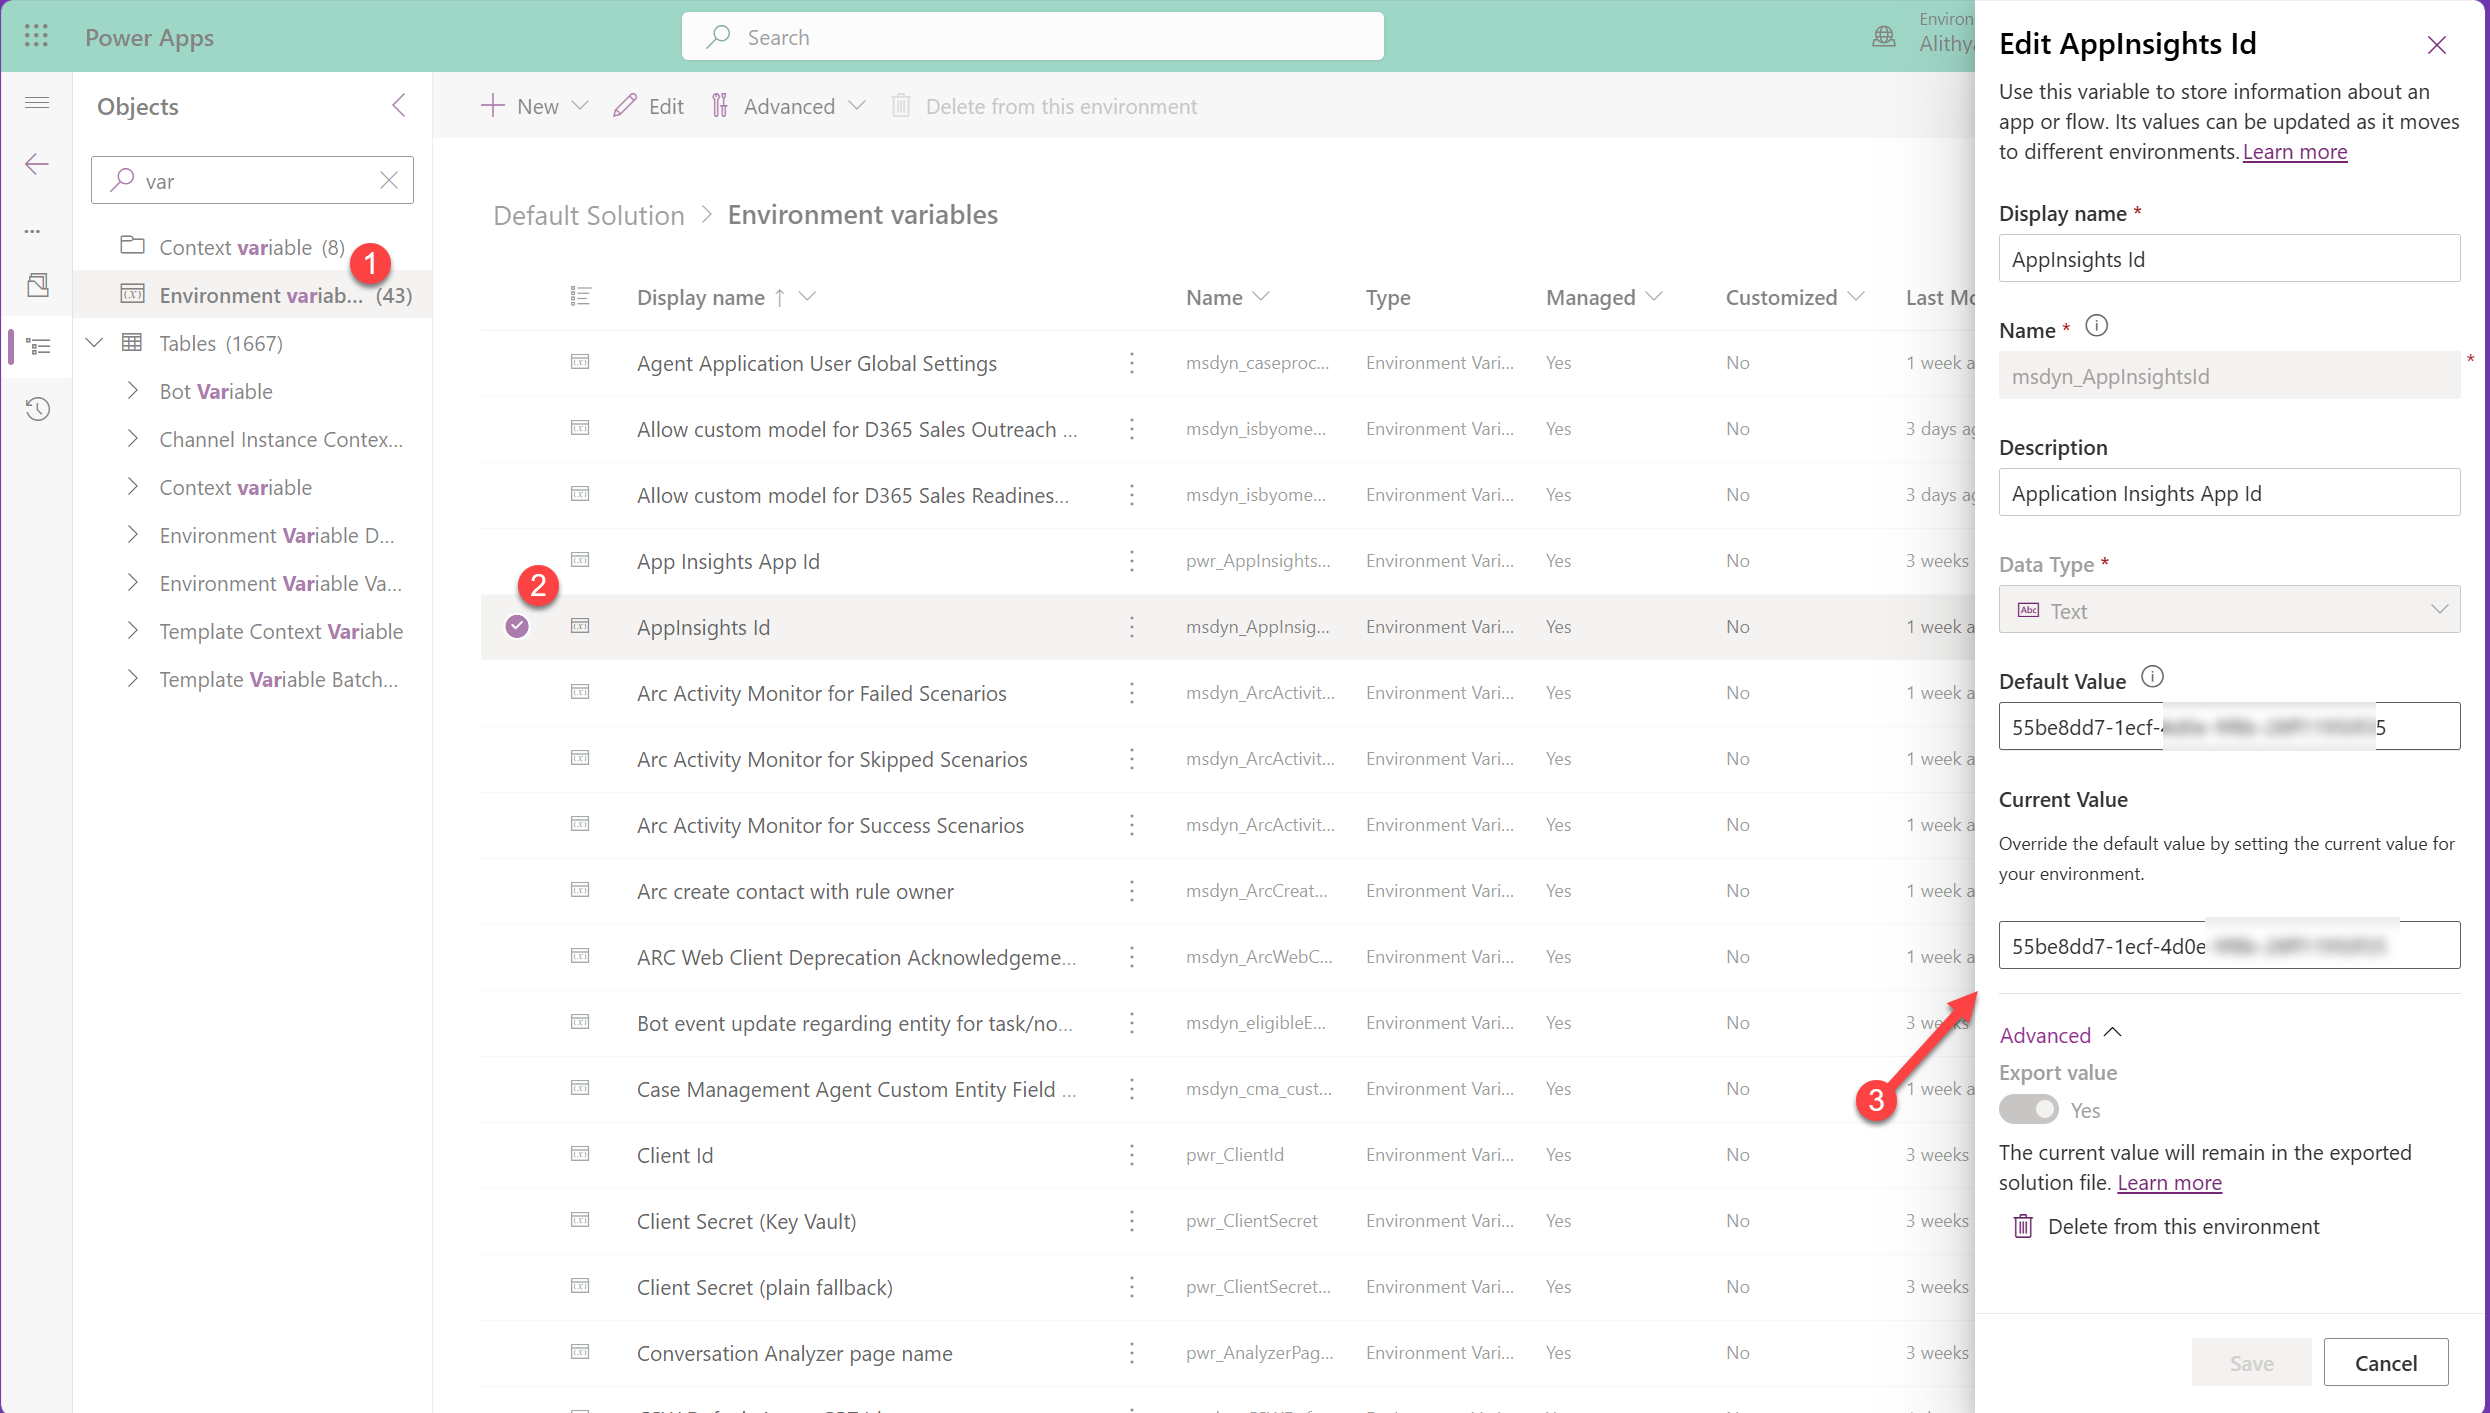
In the Azure portal, open the Application Insights resource, then select API Access. Copy the value labeled Application ID. Use that GUID, not the connection string, resource ID, or instrumentation key.
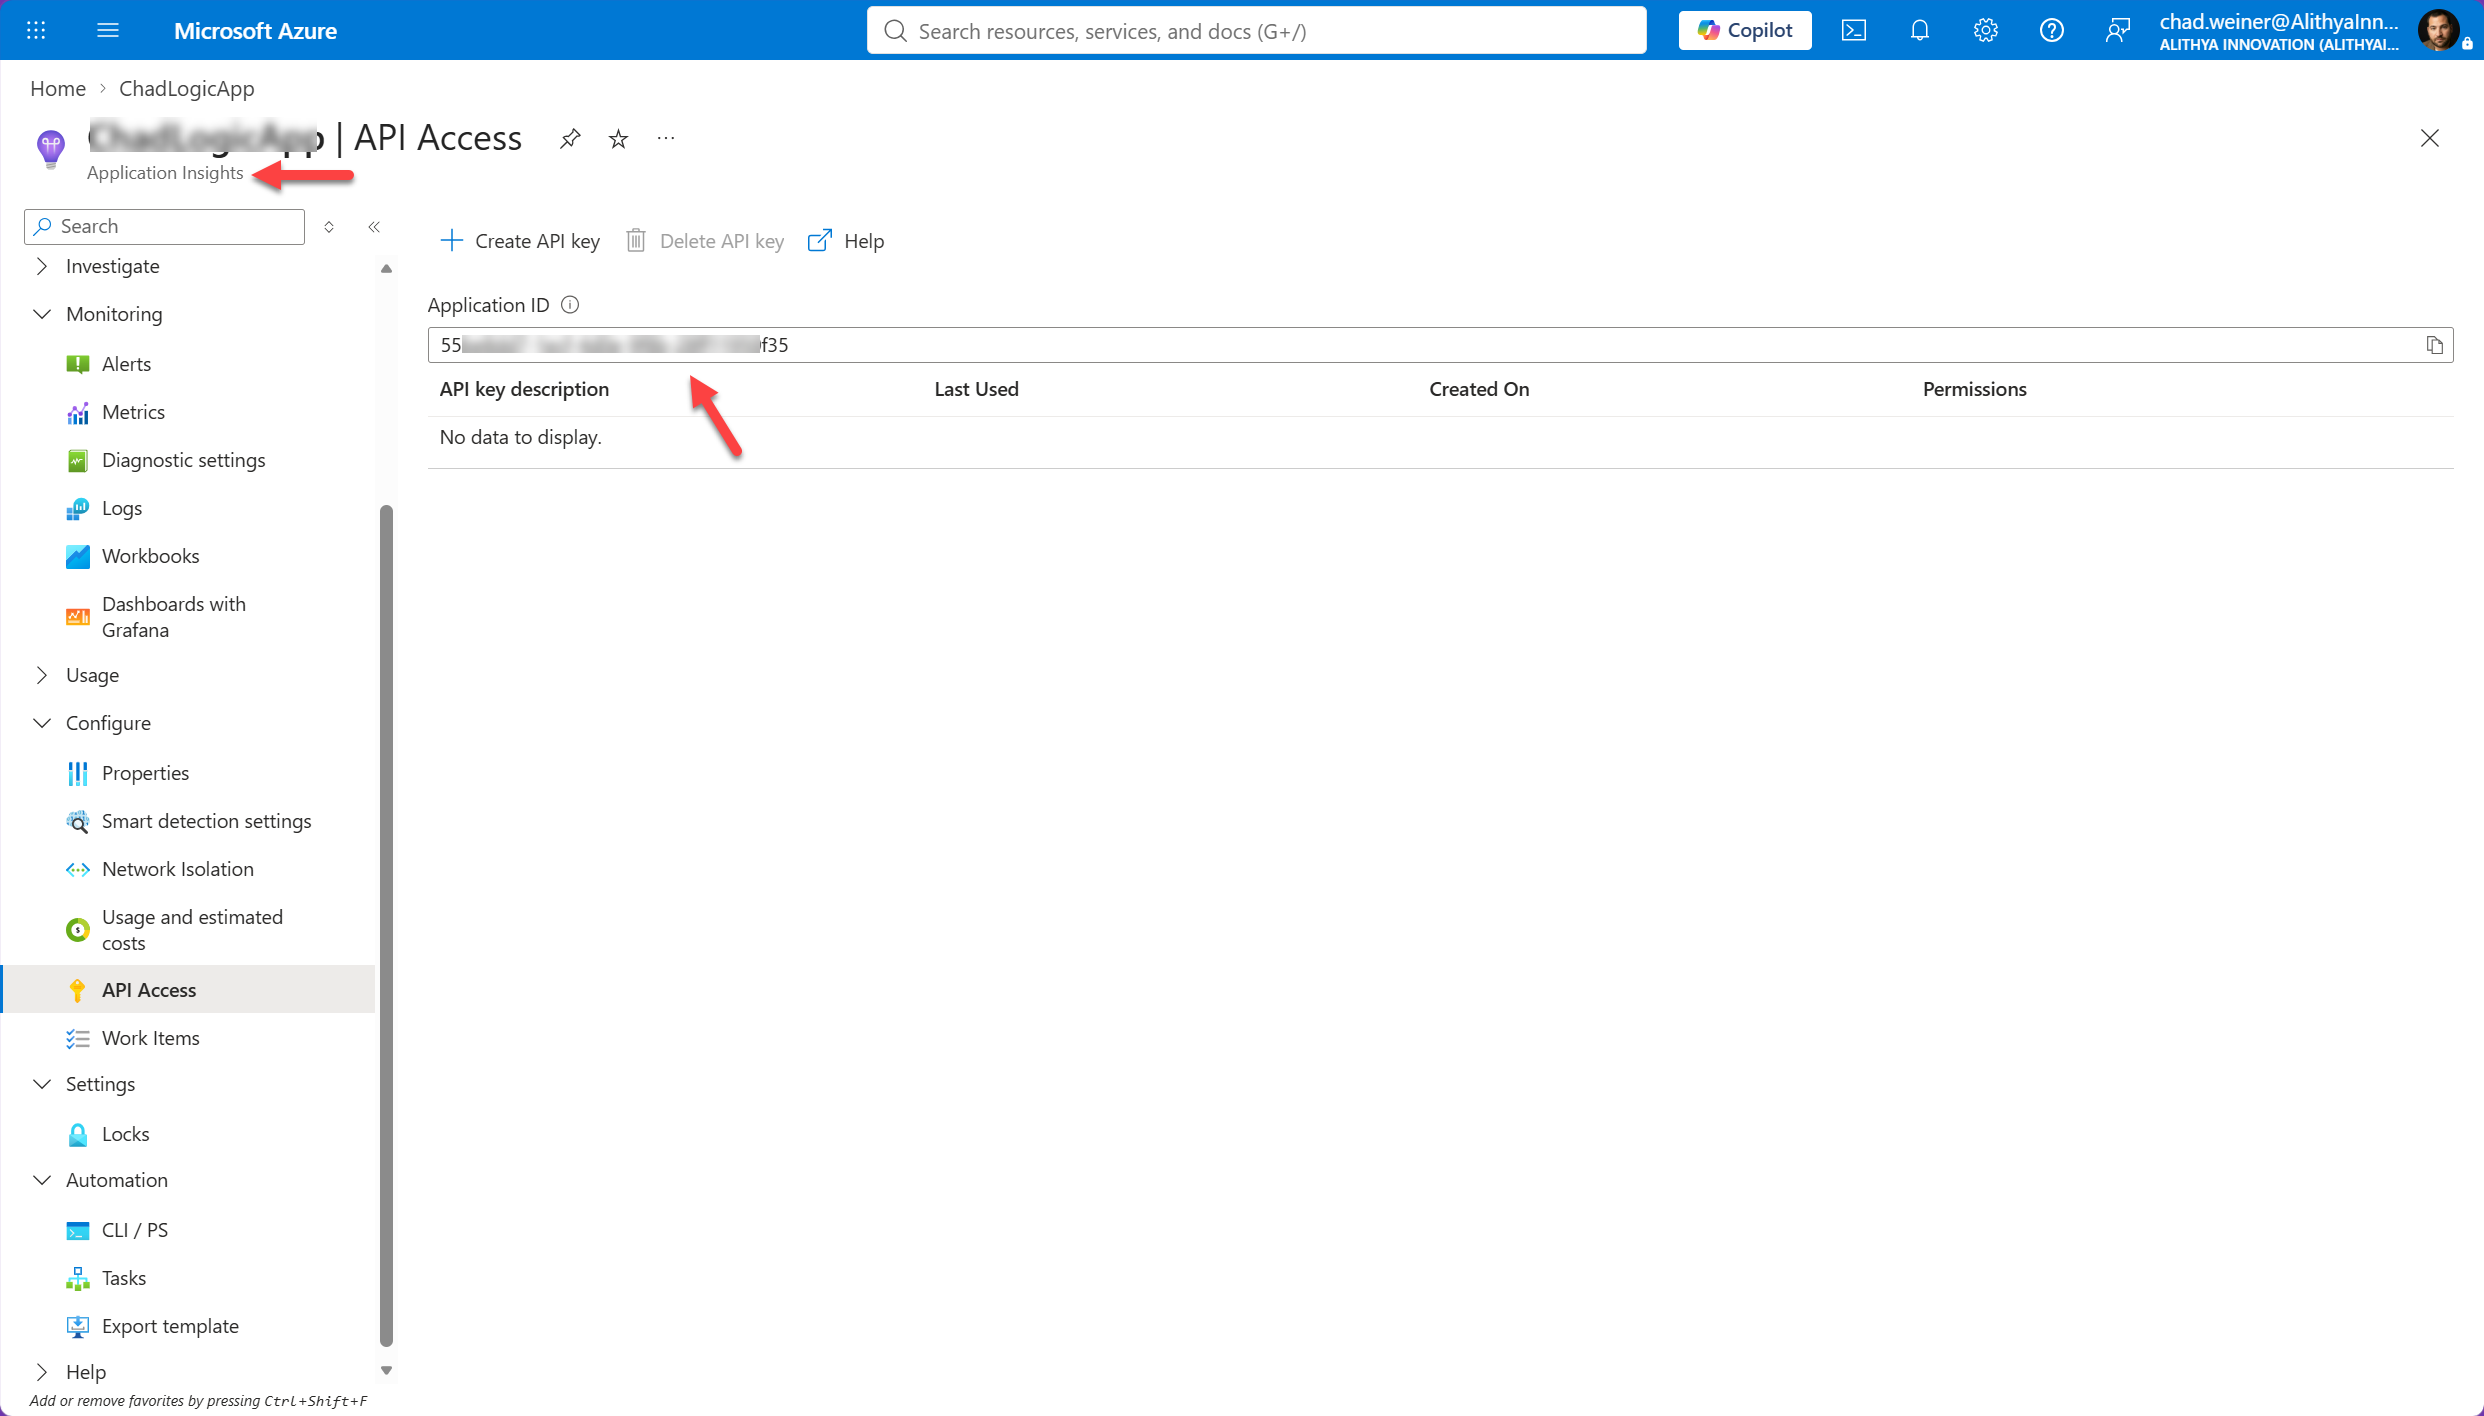
The Current Value is easy to miss. Setting only the default does not create an environment value. Select New value under Current Value, save it, then confirm that the default remains populated. On some builds, saving the Current Value clears the default, so enter the default again if necessary.
You can verify the result with this Dataverse query:
https://<yourorg>.crm.dynamics.com/api/data/v9.2/environmentvariabledefinitions?$select=schemaname,defaultvalue&$expand=environmentvariabledefinition_environmentvariablevalue($select=value)&$filter=schemaname eq 'msdyn_AppInsightsId'Both the defaultvalue and expanded value should contain the Application Insights Application ID. Neither should be null or empty.
6. Turn on the dashboard setting
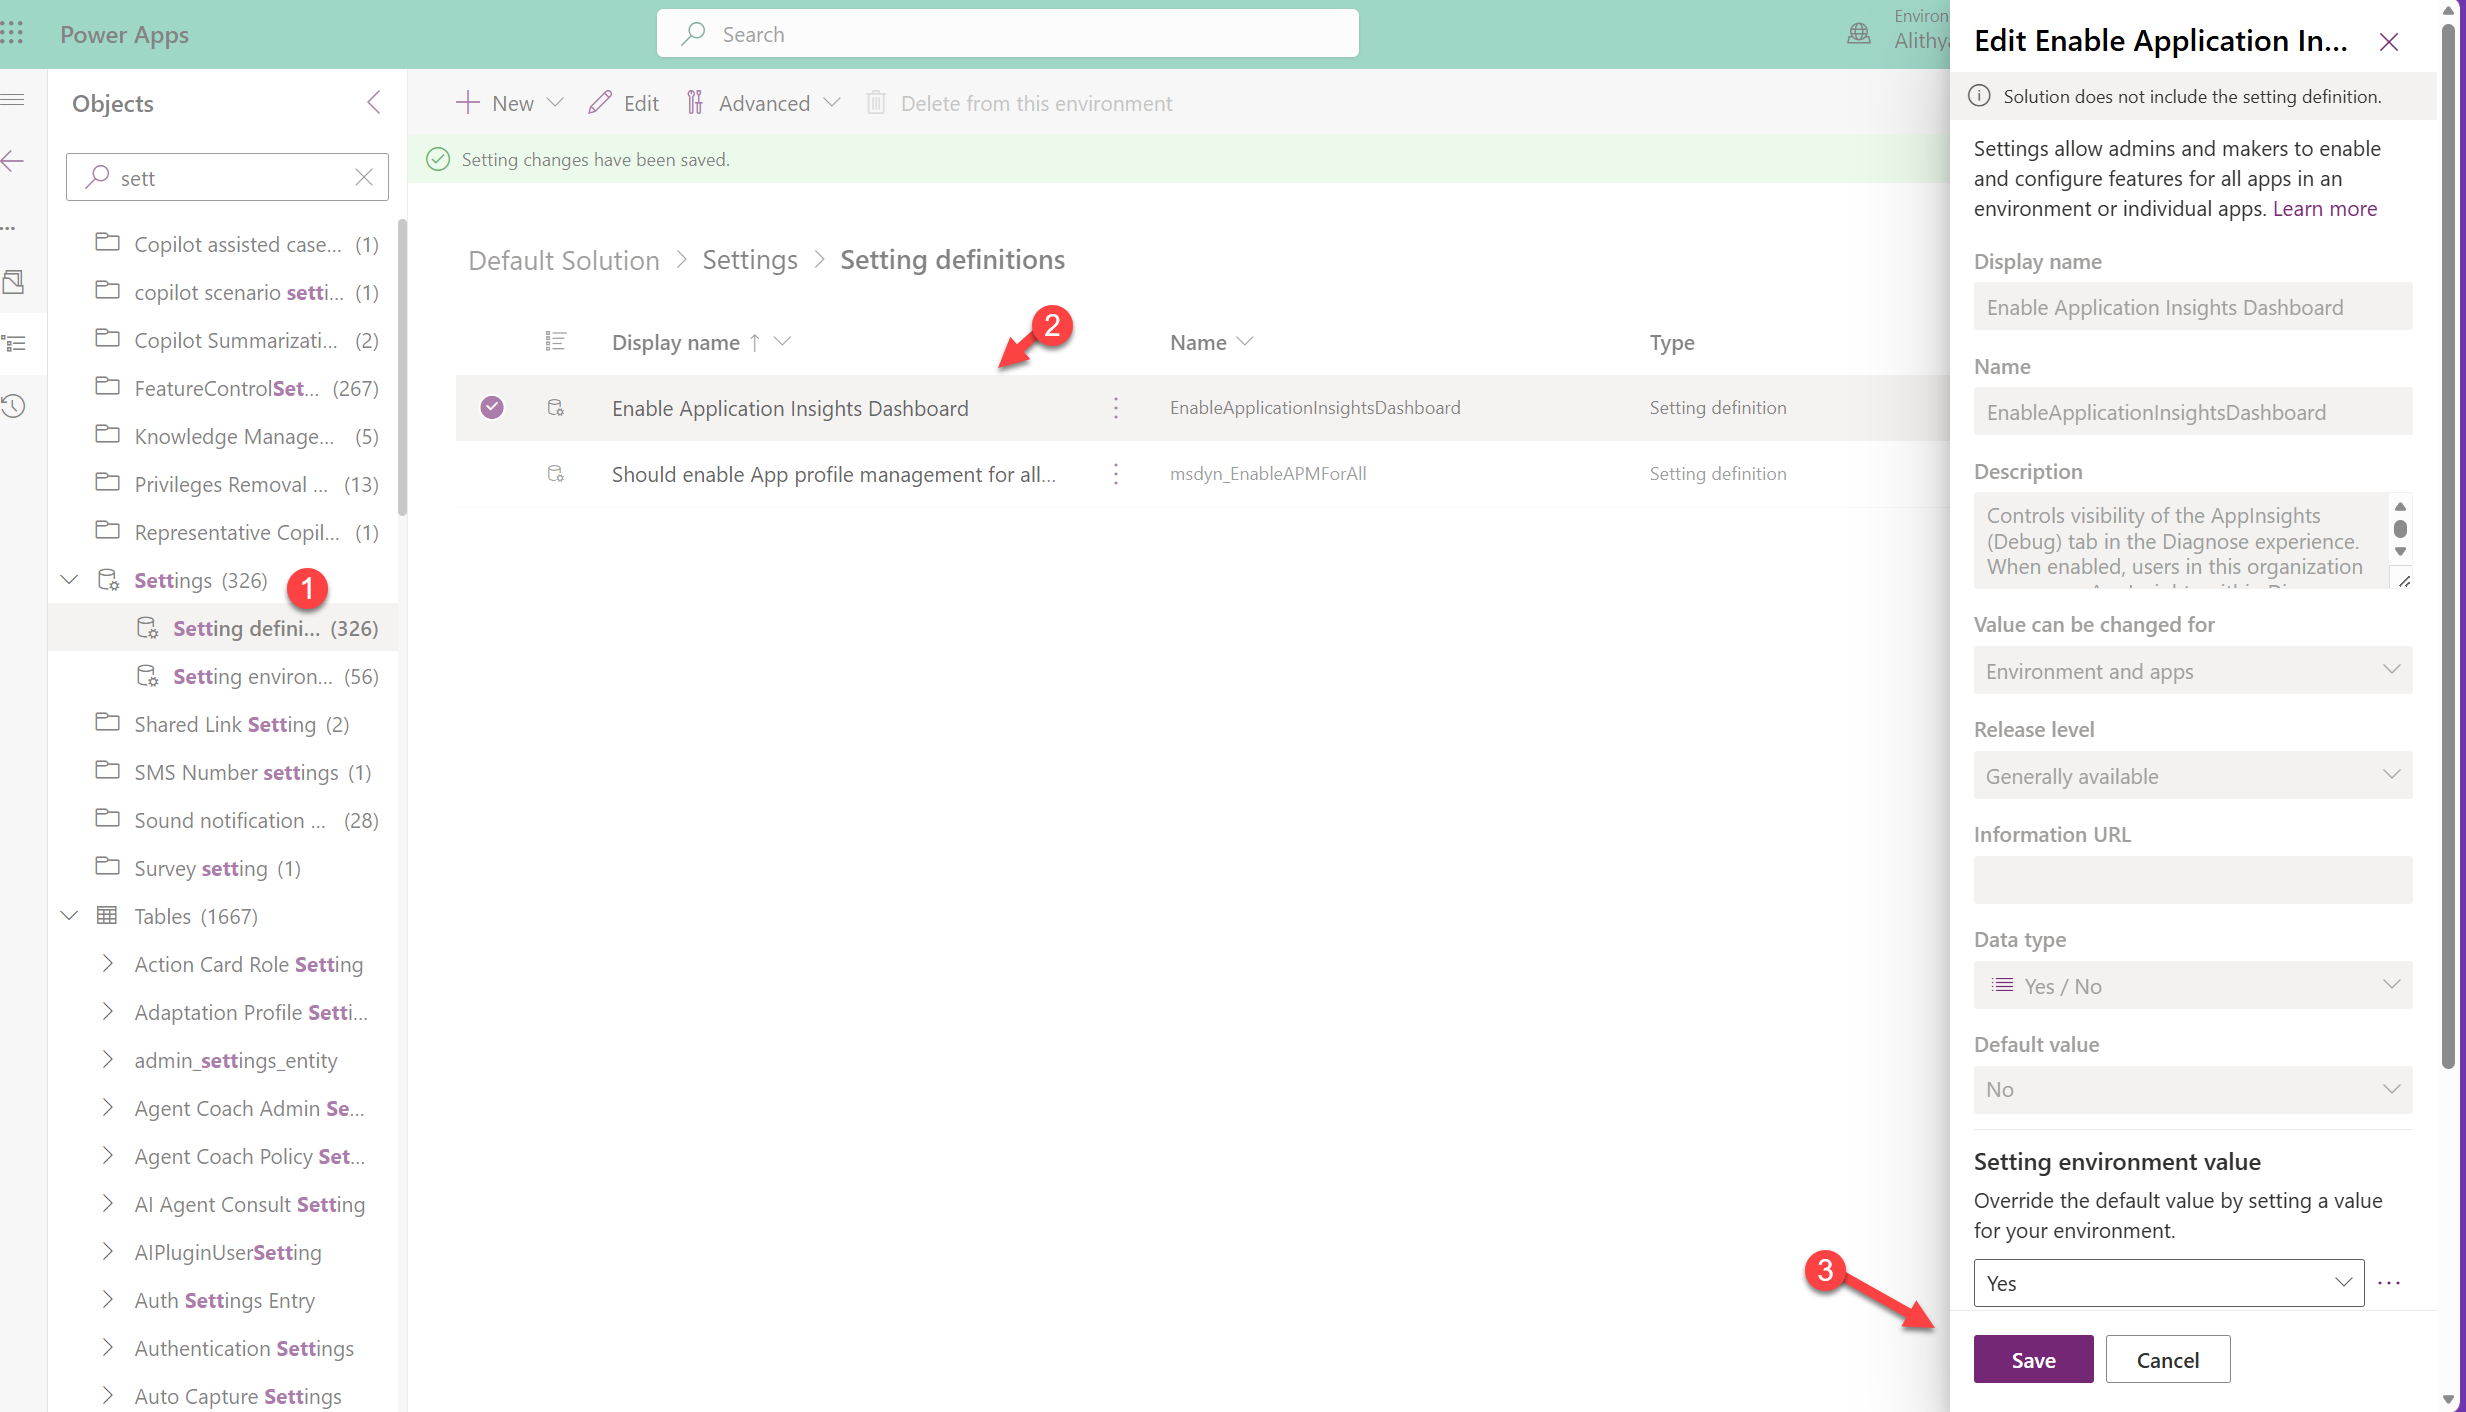
EnableApplicationInsightsDashboard is a Power Platform Settings definition, not an environment variable or an organization database setting.
In Default Solution, filter the solution objects to Settings. Open Enable Application Insights Dashboard, with the schema name EnableApplicationInsightsDashboard. Add a setting environment value of Yes and save it.
This setting controls whether the AppInsights Debug tab is available in the Diagnose experience.
7. Reload and allow time for data to arrive
Open Diagnose, select Debug, and choose Refresh. The tab can take up to about 15 minutes to reflect the configuration. Initial telemetry synchronization can take up to 24 hours before every chart has data.
If the configuration looks right but charts are empty, give the sync time before changing the identity settings again.
Troubleshoot the API call, not the generic chart message
When the dashboard fails, the browser’s Network tab is the fastest way to find the layer that broke.
- Open browser DevTools and select Network.
- Filter requests for
msdyn_GetAppInsightsTelemetry. - Refresh the Debug dashboard.
- Open the failed request and review Preview or Response.
The response usually narrows the issue down:
| Error signature | What to check |
|---|---|
AADSTS7xxxx or a 401/403 |
The FIC subject and token exchange, starting with the environment ID |
| No data and no error | Allow for the telemetry sync delay |
| Application Insights query error | The RBAC assignment and Application Insights Application ID |
Start with the subject identifier if authentication is failing. A malformed value can produce errors much later in the process, which makes the original mistake look unrelated.
The missing character that broke the setup
After confirming the app registration, role assignment, managed identity, and environment variables, I still could not load the dashboard. The issue was one missing character in the environment ID inside the FIC subject.
Incorrect:  .../plugin/e/c8afaff-dbd5-4d21-9e8c-f51901d60c2e/...
Correct:    .../plugin/e/c8afaf8f-dbd5-4d21-9e8c-f51901d60c2e/...
The first group in the incorrect GUID has seven characters: c8afaff. The correct value, c8afaf8f, has eight.
It looked close enough to pass a quick visual check, but the missing 8 prevented federation from working. The dashboard surfaced that problem as a chart-loading failure, not as an obvious GUID validation error.
Use this quick check whenever you paste the environment ID into the subject value:
- A GUID has 36 characters in an
8-4-4-4-12pattern. - The first group must contain eight hexadecimal characters.
- Copy the GUID from the Power Platform admin center. Avoid typing it by hand.
Final configuration check
Before treating this as a product issue, verify each item below:
- The app registration exists and you have its client ID and tenant ID.
- The FIC issuer and subject are correct, including the full environment GUID.
- The app registration has Monitoring Reader or Reader on the Application Insights resource.
- The Dataverse managed identity record contains the expected app and tenant IDs, with
credentialsource: 2andsubjectscope: 1. -
msdyn_AppInsightsIdhas the Application Insights Application ID in both Default Value and Current Value. -
EnableApplicationInsightsDashboardhas a setting environment value of Yes. - You refreshed the Debug tab and allowed time for configuration and telemetry synchronization.
The Diagnose dashboard is useful once it is connected, but its setup is an identity chain. Treat the subject identifier as configuration data, not a string to type from memory. That one habit can save a long troubleshooting session.
Check out the documentation to understand the dashboard components and data once you get it populated.